

Five trading models compete on the Nasdaq-100. The rule for winning was written before the race.
Overview.
Can a model pick better swing trades than chance?
Not “can it make money in a bull market”, but: do its seven picks beat seven random Nasdaq stocks taken on the same day, with the same stop, target and costs?
Every backtest looks good to its author
Tune enough variants and one of them will shine by luck. Most trading AI is built that way, then sold with its best curve.
Models compete under fixed rules
Different model families face the same unseen years, the same trade and a winning rule written in advance. The champion goes live on paper; the verdict is printed next to the signals.
The models.
LightGBM
Gradient-boosted trees on 31 price, volume and market features known at the close: returns over 1 to 120 days, volatility, ATR, distance to the 20, 50 and 200-day averages, RSI, gaps, relative strength against QQQ, VIX, plus cross-sectional ranks.
LightGBM + earnings
The same trees plus post-earnings drift: the last surprise, days since the report, the price reaction and its streak. A report only counts from the first day the market could trade it.
LSTM
A recurrent network on each stock's last 20 days × 13 inputs, trained with PyTorch on the M1 GPU (Metal).
Transformer
A two-layer encoder with learned positions over the same 20-day sequence, so it can weigh any day of the window against any other.
Ensemble
The average of the four models' within-day percentile ranks, which removes their different score scales.
2010 to today
Daily prices for every ticker plus QQQ and the VIX, and each company's earnings history, refreshed every week from Yahoo Finance and stored as Parquet.
The rules.
- 1Walk-forward, never shuffledEach model is retrained every year on earlier data only and scored on the next, unseen year, 2019 to 2026. A purge gap of 12 days keeps any training label from overlapping the test year.
- 2The same trade for everyoneEnter at the next open, stop at 1×ATR, target at 2×ATR, exit after 5 days at the latest, minus 0.10% round-trip costs. When a day touches both stop and target, it counts as the stop.
- 3A champion rule written firstBefore any result: the winner is the model whose top-7 picks beat the average of all stocks by the highest overlap-adjusted t-statistic. It is called proven only if t ≥ 2.
- 4Every attempt is countedEach configuration ever tested is logged in trials.json, and the Sharpe ratio is deflated for that number of trials (Bailey and López de Prado), so trying many variants can't manufacture a result.
Results.
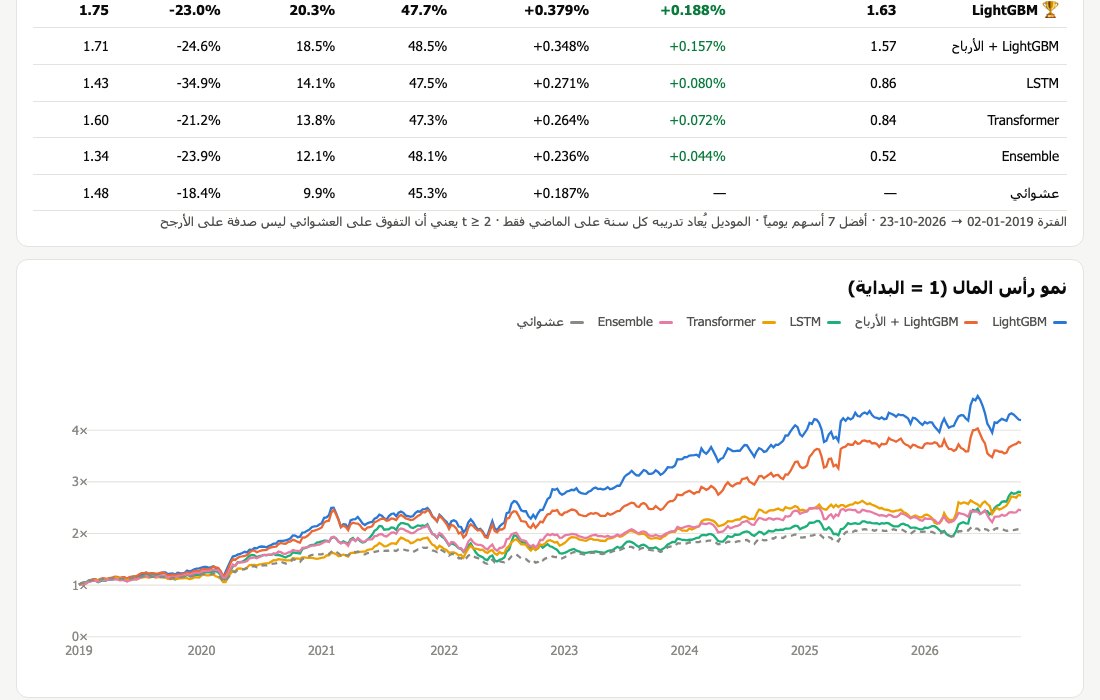
| Model | t vs random | Excess / trade | Expectancy | Win rate | Profit factor | CAGR | Max drawdown | Sharpe |
|---|---|---|---|---|---|---|---|---|
| LightGBM 🏆 | 1.63 | +0.188% | +0.379% | 47.7% | 1.21 | 20.3% | -23.0% | 1.75 |
| LightGBM + earnings | 1.57 | +0.157% | +0.348% | 48.5% | 1.2 | 18.5% | -24.6% | 1.71 |
| LSTM | 0.86 | +0.080% | +0.271% | 47.5% | 1.15 | 14.1% | -34.9% | 1.43 |
| Transformer | 0.84 | +0.072% | +0.264% | 47.3% | 1.17 | 13.8% | -21.2% | 1.6 |
| Ensemble | 0.52 | +0.044% | +0.236% | 48.1% | 1.15 | 12.1% | -23.9% | 1.34 |
| Random 7 picks | – | – | +0.187% | 45.3% | – | 9.9% | -18.4% | 1.48 |
Better than chance on every line, not yet proven
The champion's picks earned +0.188% more per trade than the average stock and roughly doubled the random portfolio's growth (20.3% against 9.9% a year), with a higher Sharpe. But t = 1.63 is below the 2.0 the rule demands, and the edge shrank in 2025 and 2026. So the arena calls it unproven, and so do I.
Buying QQQ was hard to beat
In the v1 study (2019-01-02 to 2026-09-30), simply holding QQQ grew 23.1% a year with a -35.1% drawdown. The champion grows a little less with a much smaller drawdown (-23.0%). The win rate under 50% is normal here: targets are twice as far as stops.
The daily loop.
- 117:30 New York, Monday to FridayDownload the day's prices and earnings, close the paper trades that hit their stop, target or day 5, and post the results with the running total.
- 2Score and pickLoad the saved champion, score every ticker on today's close and keep the top 7 with stop and target levels from each stock's ATR.
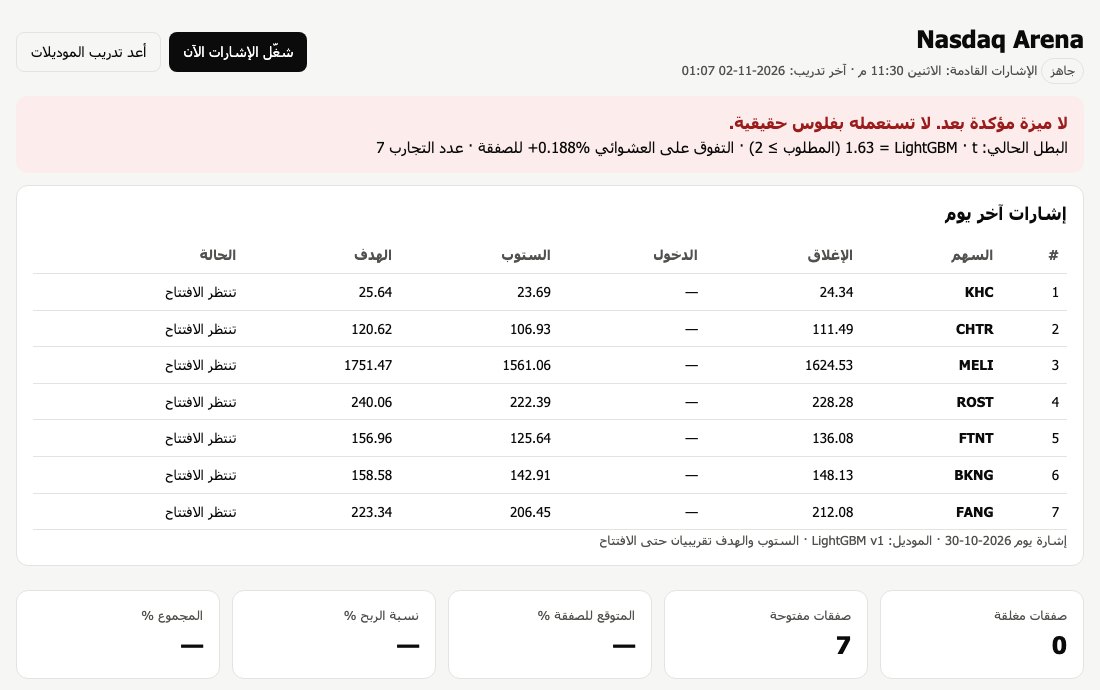
- 3Publish with the verdictWrite the signals to the ledger before the open and send them to Telegram with the model's name and the current verdict. Telegram delivery is wired; until a bot token is set, messages go to the log.
- 4Saturday 10:00Refresh all data, rerun the full walk-forward arena, crown a champion by the rule and refit every model on all history for the coming week.
Architecture.
Engineering deep dives.
1. Beating the market is the wrong test
- Problem
- In a bull market almost any long-only strategy looks good. Picking 7 random Nasdaq stocks every day with the same stops made 9.9% a year here.
- Approach
- The arena measures each model against random picks from the same stocks on the same days: the daily excess return of its top 7 over the all-stocks average, as a t-statistic adjusted for 5-day overlapping trades. That isolates stock-picking skill from the market's direction.
- Trade-off
- A model can make money and still fail the test. That is the point.
2. Leakage is the default, so it is designed out
- Problem
- Daily stock data leaks the future in quiet ways: labels that end after the test starts, earnings dated by announcement instead of first tradable day, rows shuffled across time.
- Approach
- Features use only what is known at day t's close. Labels are triple-barrier trade outcomes from the next open. Training stops 12 days before each test year. Earnings after the close count from the next session. Sequences for the neural models are built per stock with zero padding, never across tickers.
- Trade-off
- Yearly refits are slower to adapt than quarterly ones; the v1 study refit quarterly and found no gain worth the compute.
3. Deep learning on a laptop, without pretending
- Problem
- LSTMs and Transformers are the fashionable answer for prices. On an M1 Pro, they have to be small to train inside a weekly job.
- Approach
- Both networks see 20 days × 13 normalised inputs, train for 4 epochs in batches of 4,096 on Apple's Metal (MPS) backend, with fixed seeds for repeatable runs. They enter the same arena as the trees, under the same rule.
- Trade-off
- They lost to gradient boosting on this data: t = 0.86 and 0.84 against 1.63. Tabular daily features favour trees.
4. A server that runs while I sleep
- Problem
- Signals are only useful if they appear every evening and the models are refit every week, even when the Mac was closed at the scheduled time.
- Approach
- A FastAPI app with APScheduler in New York time (so US daylight saving is handled): the daily job Mon–Fri at 17:30 closes finished paper trades and posts the next day's 7; the retrain job on Saturday refreshes prices and earnings, reruns the arena and refits every model. Missed jobs run on wake within 6 hours. launchd keeps the server alive.
- Trade-off
- Market data comes from Yahoo Finance, which drops delisted tickers without warning; the job logs it and carries on.
5. Paper trades, recorded like real ones
- Problem
- A backtest is a story told afterwards. The only honest track record is one written before the outcome.
- Approach
- Every signal is appended to a ledger before the market opens: ticker, score, ATR and reference close. The next runs fill the entry at the open, the stop and the target, then close it on the stop, the target or day 5, net of costs. Messages state that the score ranks stocks and is not a win probability.
- Trade-off
- The ledger started on 30 October 2026; it needs months before it means anything.
6. Saying “not proven” on the dashboard
- Problem
- Trading tools show the best backtest in green. Users read it as a promise.
- Approach
- The dashboard and the signal message carry the arena's verdict: while the champion's t-statistic is below 2, a red banner says there is no confirmed edge and the signals must not be used with real money. The verdict comes from the same JSON the leaderboard reads, so it cannot drift from the numbers.
- Trade-off
- It makes the product look weaker in a screenshot, and more trustworthy in a conversation.
What I learned.
Simpler beat fancier
A meta-labelling filter on top of the first model, the textbook upgrade, cut the yearly growth from 17.1% to 8.8% in the v1 study. Averaging all four models was the weakest arena entry (t = 0.52).
Trees beat sequences here
On daily tabular features, LightGBM beat both neural networks by a wide margin, and adding earnings drift did not beat plain LightGBM overall, though it did better in 2024 and 2025.
Next steps
A survivorship-free universe with past index members, months of paper trades before any claim, sector and market-regime features, and switching on the Telegram channel once the ledger has something honest to show.