
 Scenova
A cash-flow decision lab for a company that is profitable on paper and running out of cash.
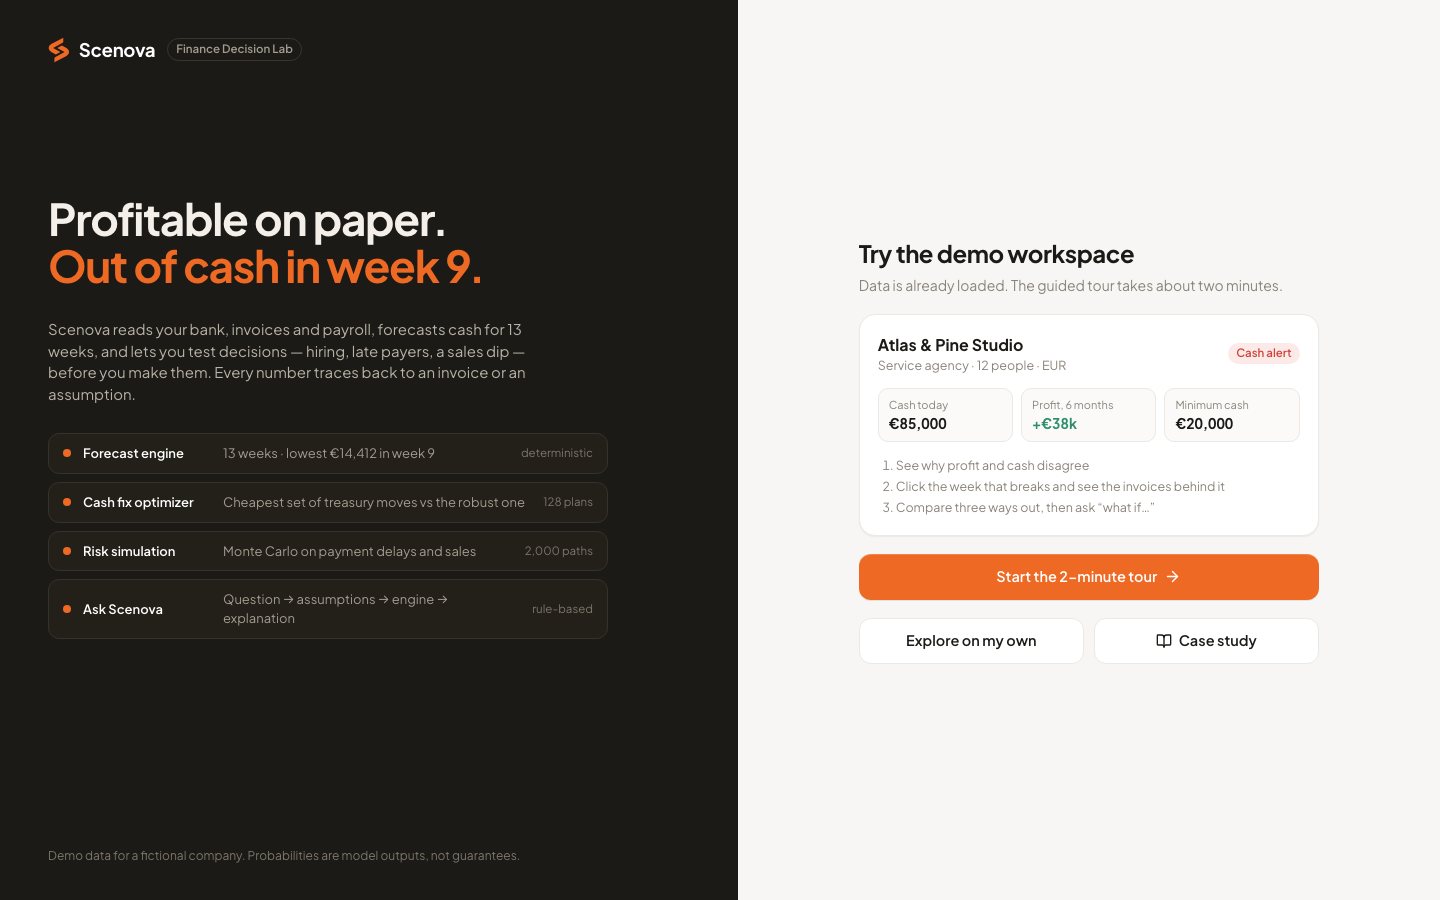
Overview.
Finance leads at small service companies
Companies that invoice clients, run payroll every month and depend on a few large clients who pay late. The demo company and all of its data are fictional.
Profit says fine, the bank says otherwise
A P&L can't answer the questions that matter: why is cash falling if we are profitable, can we hire two people next month, what if our largest client pays a month late, and which fix helps most?
A forecast you can question
Every weekly number opens into the invoices and rules behind it. Decisions become scenarios on the same engine, an optimizer prices the cheapest fix, and a backtest shows where the model is wrong.
Walkthrough.
Why a profitable company is running out of cash
The demo company, Atlas & Pine Studio, is a fictional 12-person agency. It made +€38k profit in six months while its bank balance fell €71k. The overview shows both numbers side by side, the bridge between them, and the week where cash breaks.
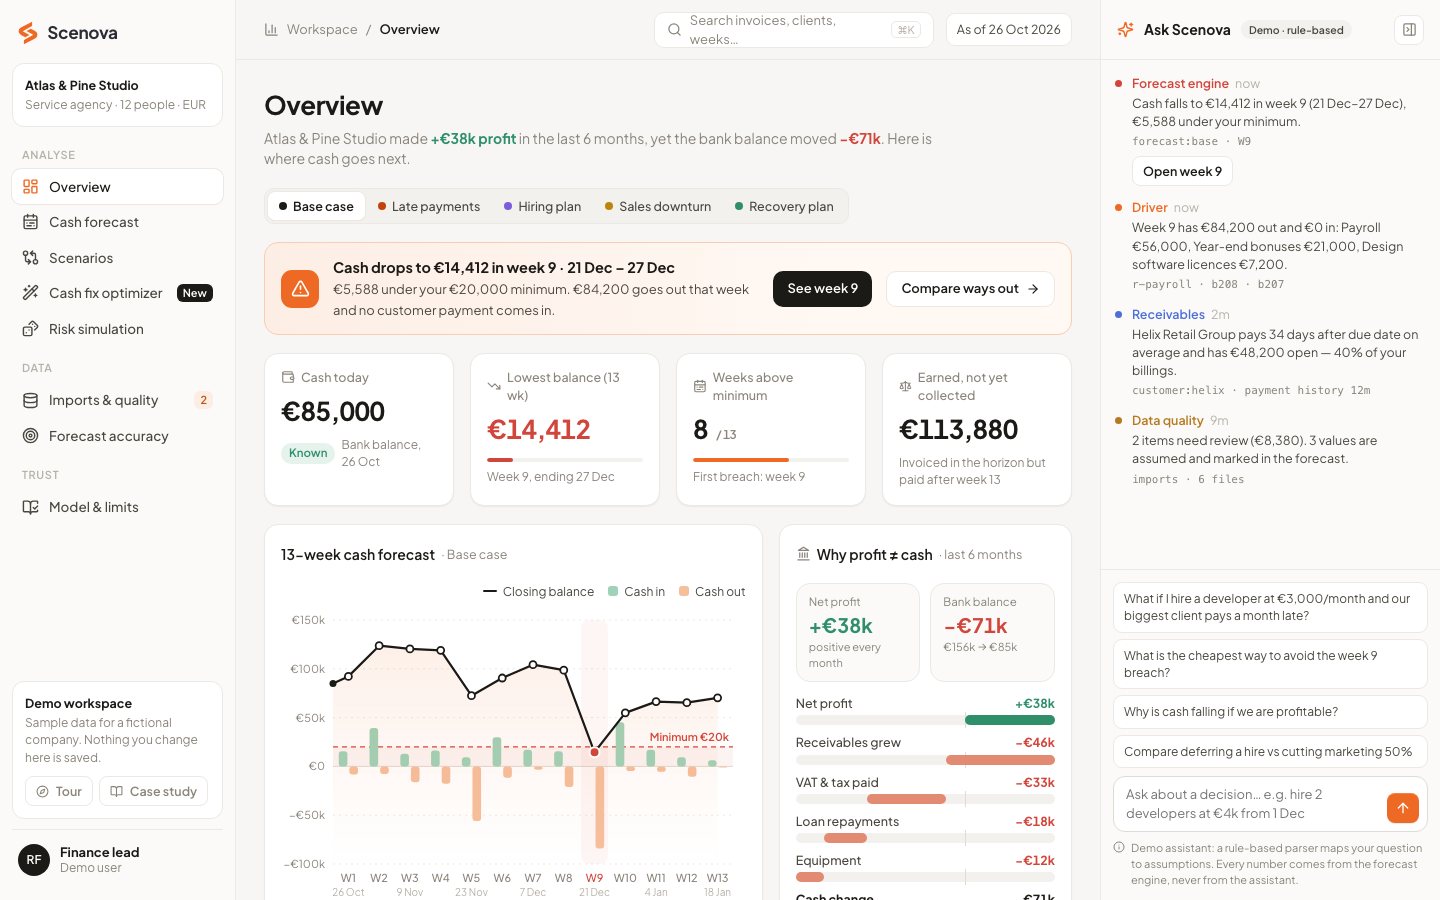
- 1Profit is not cashReceivables grew by €46k, and VAT and tax, loan repayments and equipment never appear in operating profit. The bridge shows each one.
- 2The week that breaksCash drops to €14,412 in week 9, €5,588 under the €20,000 minimum the finance lead has set.
- 3Every number labelledValues are marked known, assumed or needs review, and two imported items are flagged for a check before anyone relies on them.
Click the week that breaks and see the invoices behind it
The forecast runs week by week: opening balance plus cash in minus cash out. Clicking week 9 opens every line that moves money that week, with its date, rule and source.
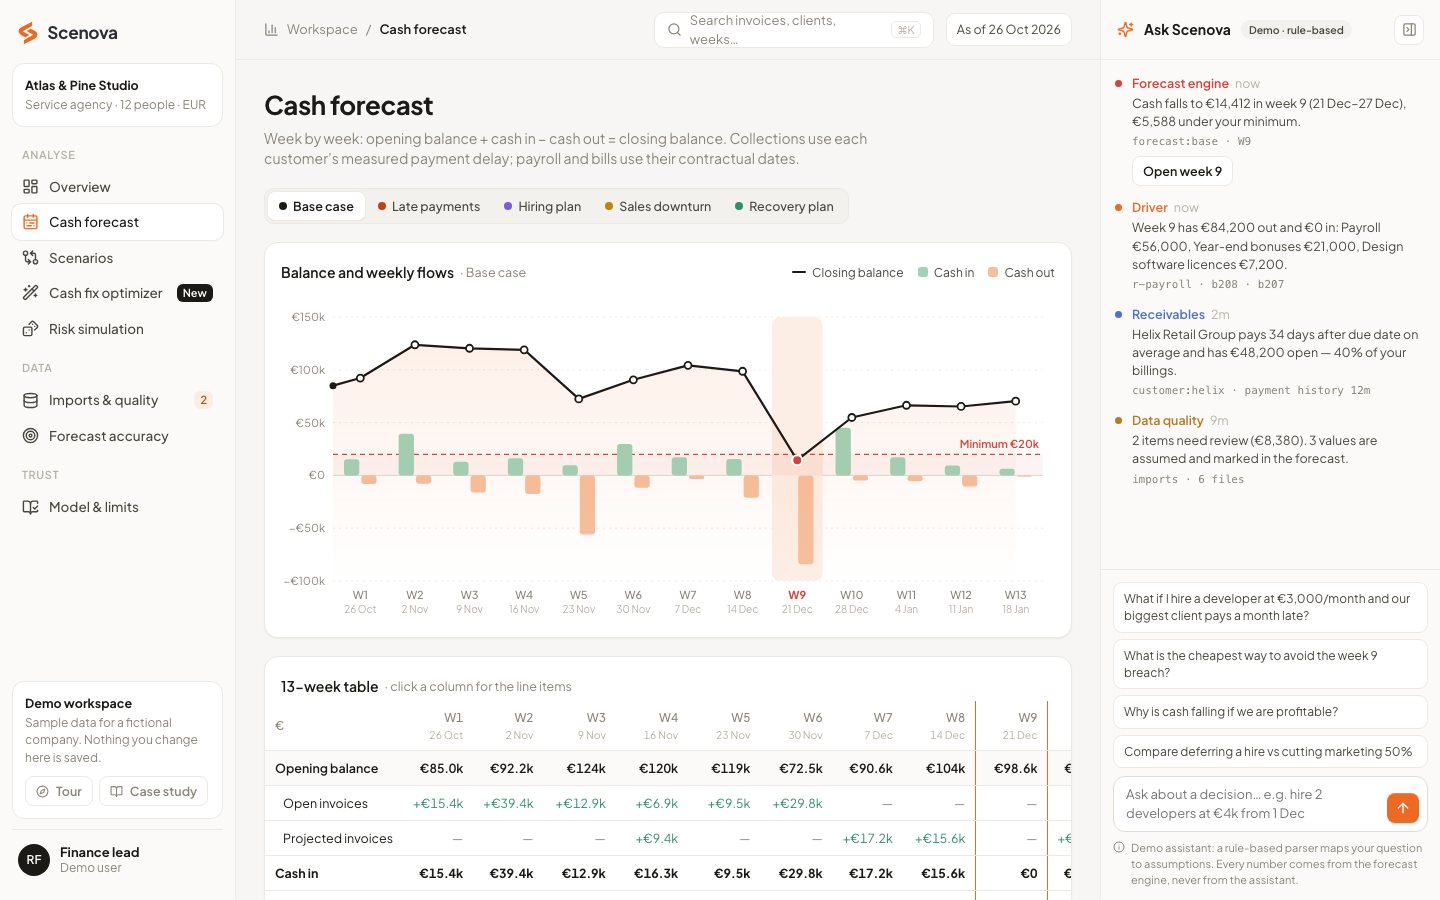
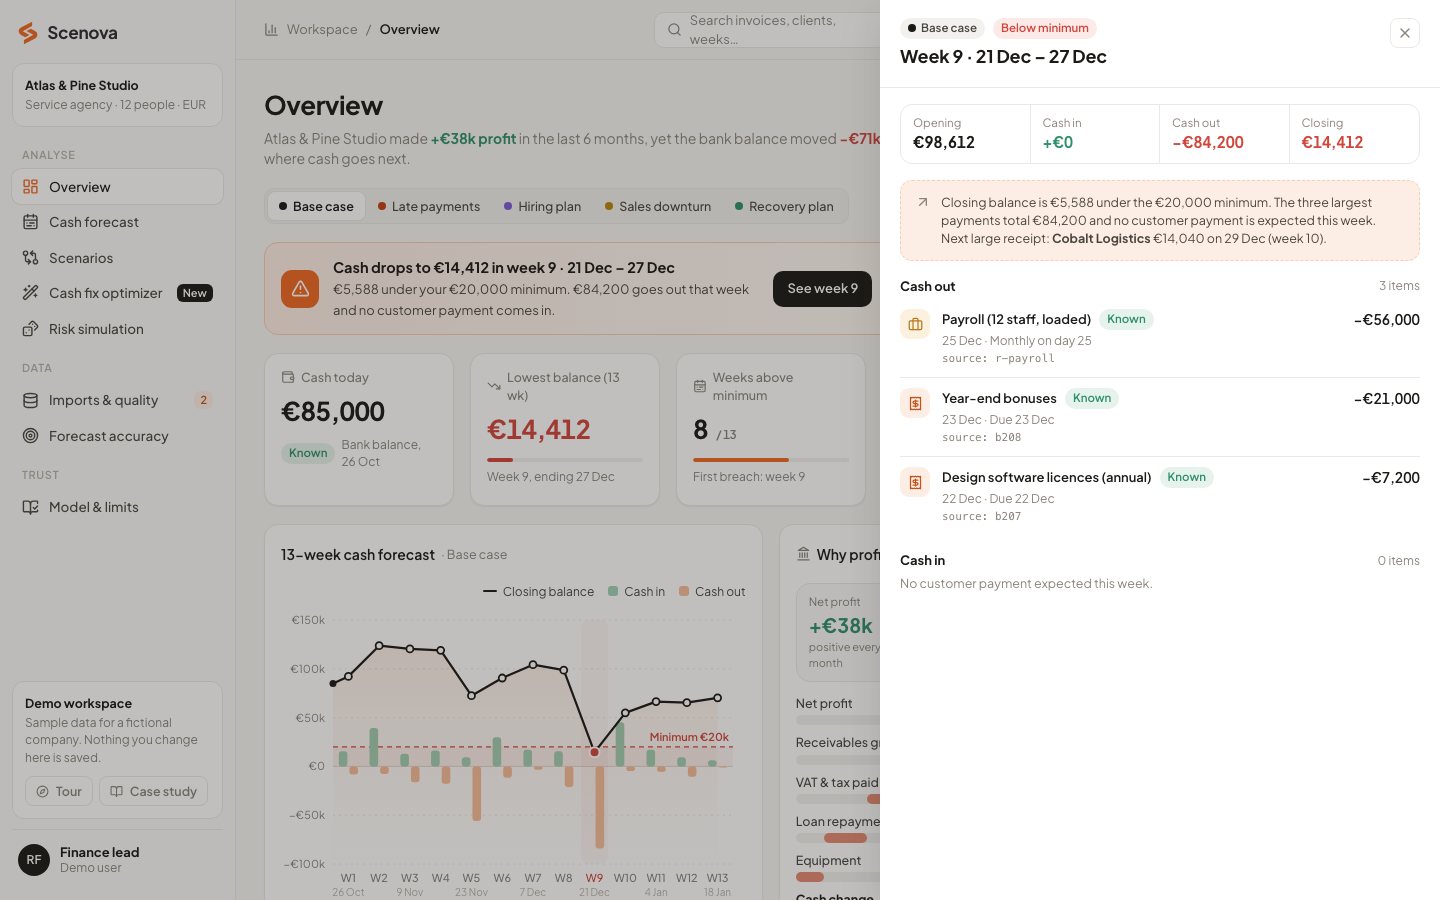
- 1Traceable linesPayroll €56,000, year-end bonuses €21,000 and software licences €7,200, each tied to a payroll rule or a bill id.
- 2Client habits, measuredA client payment lands on its due date plus that client's measured average delay. Helix Retail pays 34 days late on average.
- 3The next receiptThe drawer also says when the next large payment arrives, so the gap has an end date.
Decisions become scenarios on the same engine
Late payments, a hiring plan, a sales downturn and a recovery plan run through the same forecast. A custom scenario has its own sliders. The comparison shows the lowest balance, the first week below the minimum and the change against the base case.
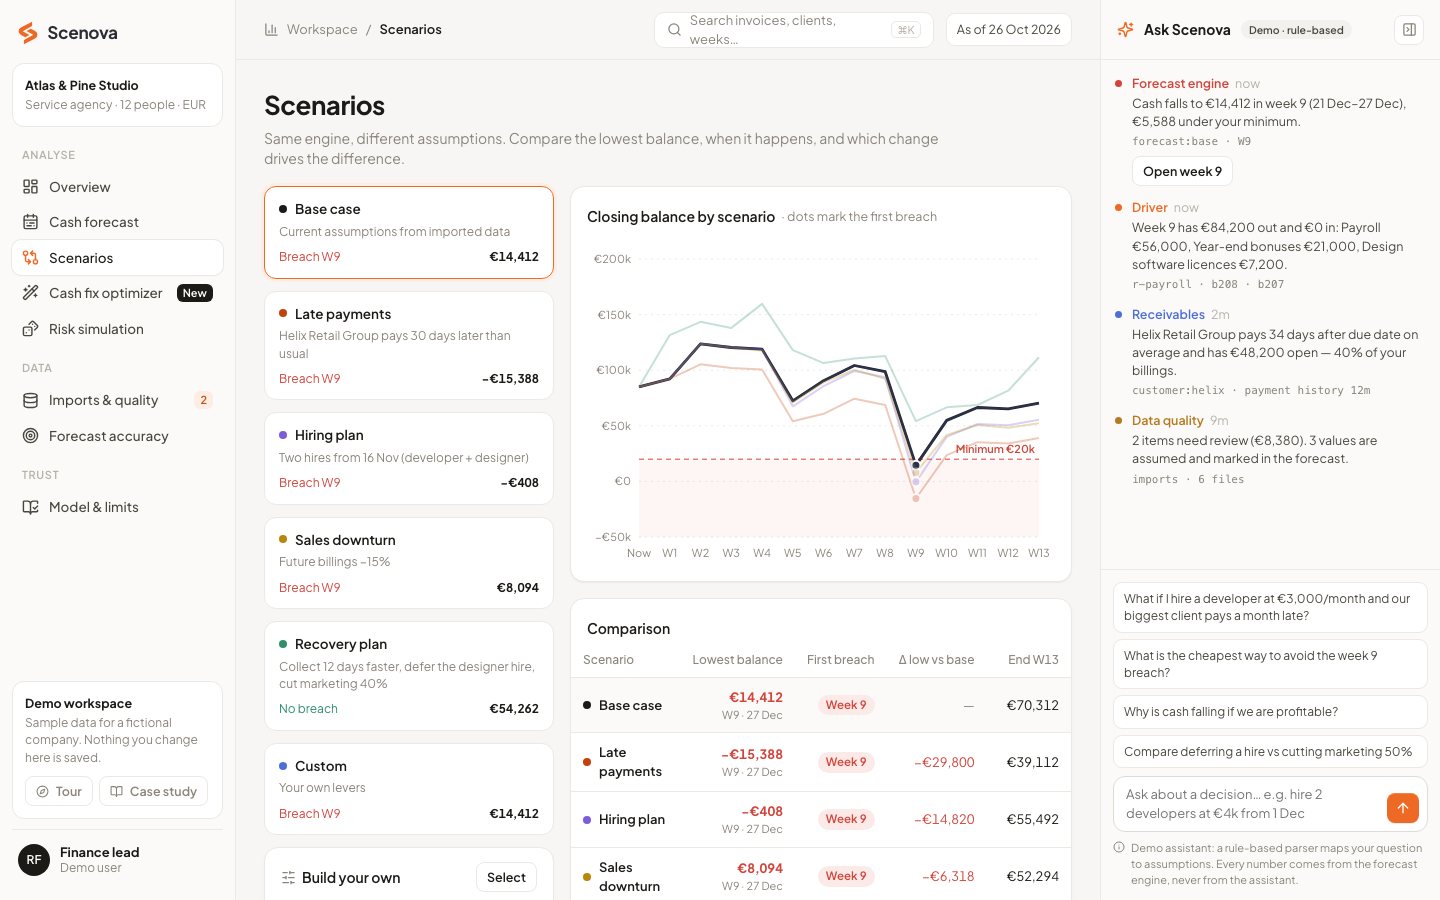
- 1Late clientIf Helix Retail pays 30 days later than usual, the low point falls to −€15,388.
- 2Hiring planTwo hires from 16 November take the low point to −€408. The recovery plan never breaches.
- 3One change at a timeEach change in a scenario is measured on its own, so the finance lead sees which one moves the result.
An optimizer that prices the fix
Seven treasury moves are available, such as early-payment discounts for clients, moving a vendor invoice, an overdraft and a tax deferral. Every combination runs through the forecast, and the best plans are stress-tested against uncertain payment dates.
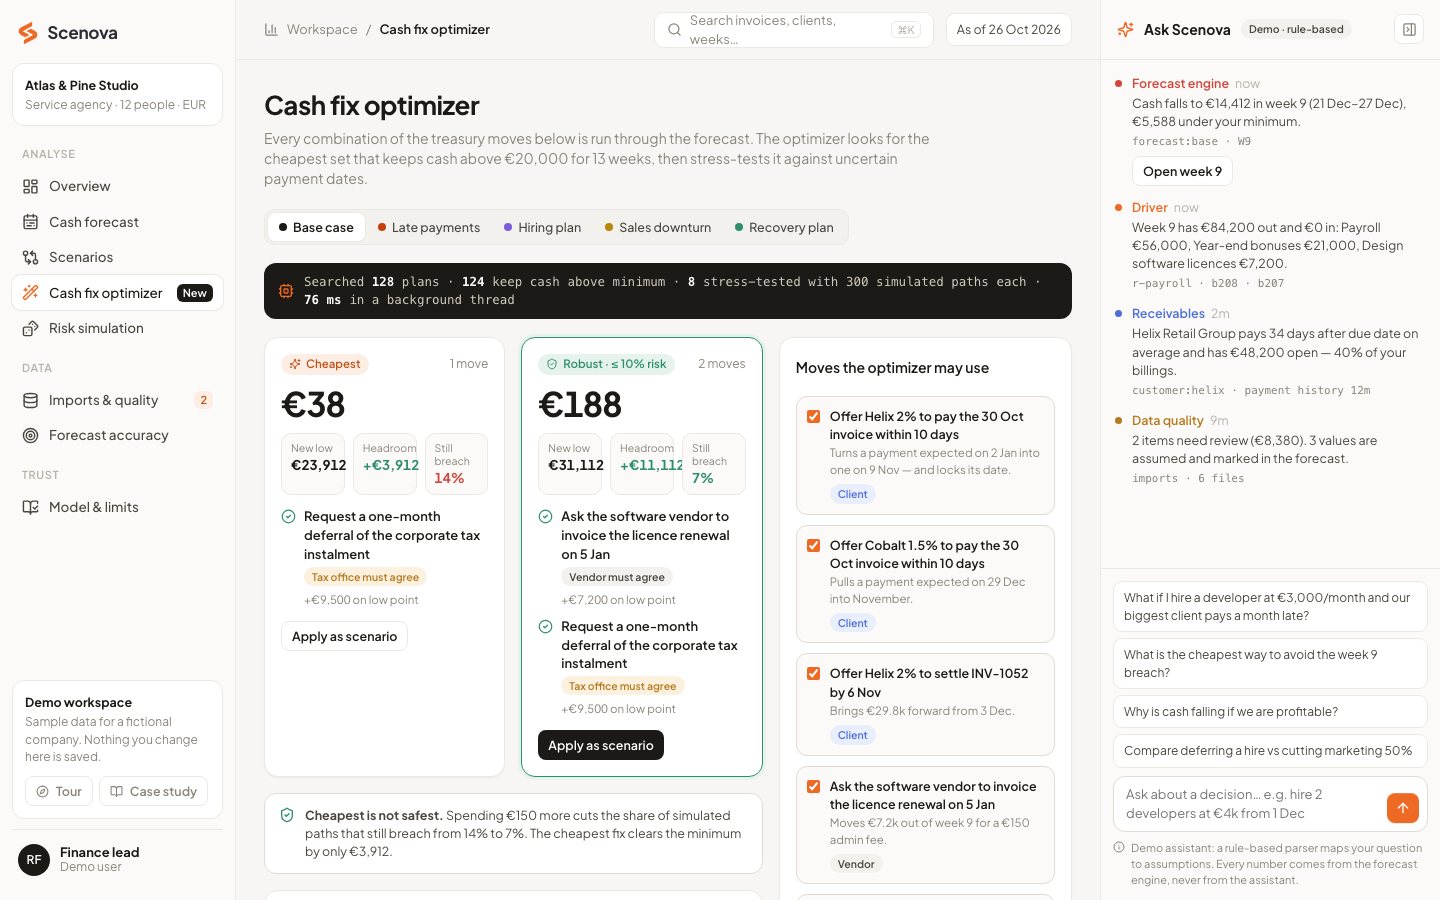
- 1CheapestOne move, a one-month tax deferral, costs €38 and keeps cash above the minimum, but 14% of simulated paths still breach.
- 2RobustAdding a vendor move costs €188 and cuts the share of breaching paths to 7%. The page shows the trade instead of hiding it.
- 3Who must agreeEach move is tagged with who has to say yes (a client, a vendor or the tax office) and can be applied as a scenario.
2,000 possible futures instead of one
Payment delays and monthly sales are uncertain, so the risk page simulates 2,000 paths with delays drawn from each client's own history. The result is a share of model runs, and the page says so.
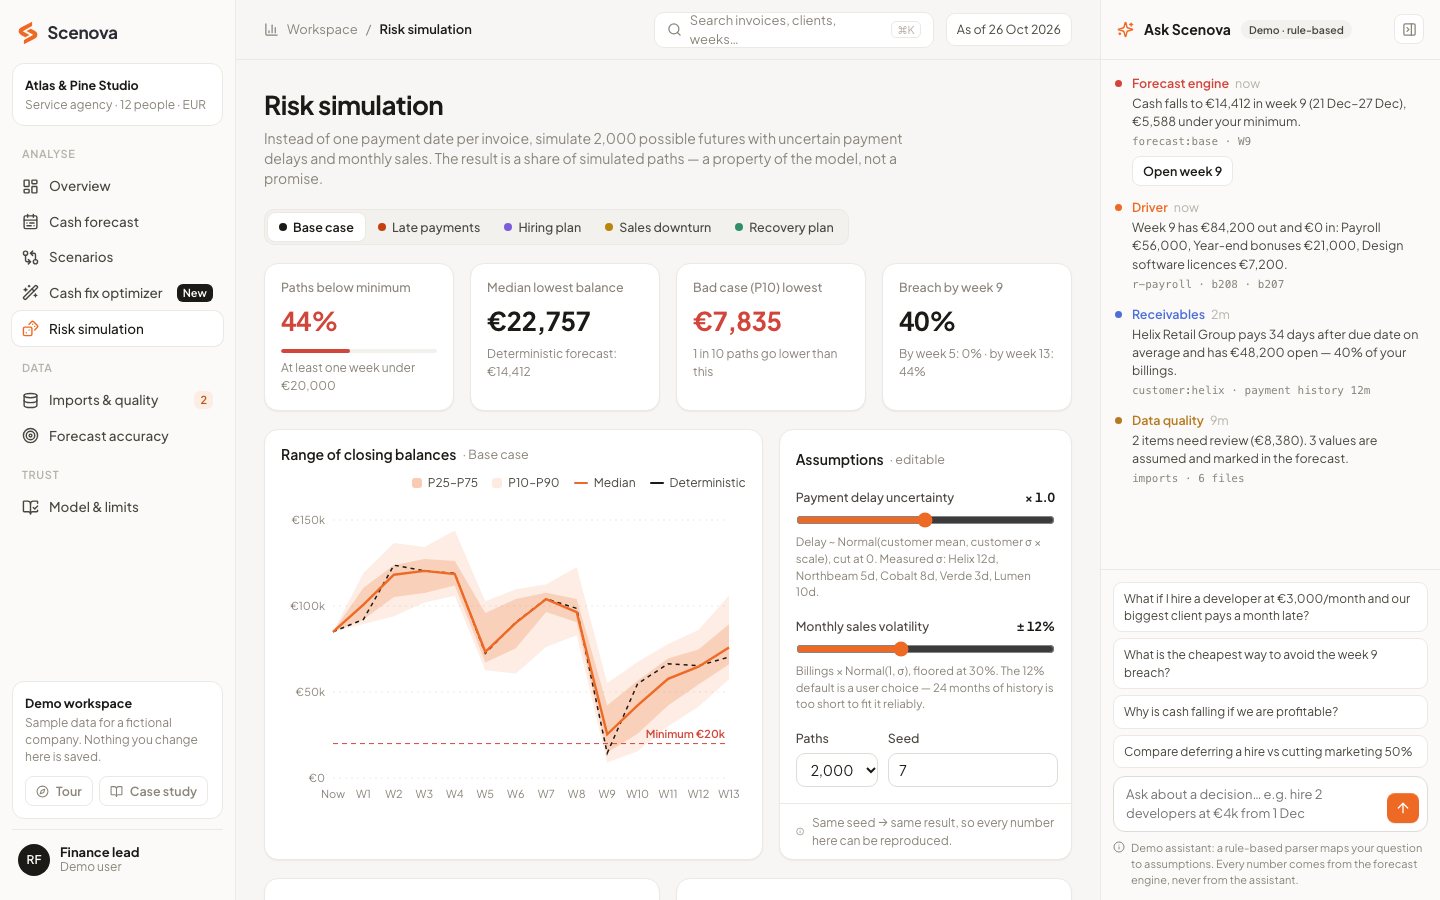
- 1Base case44% of paths fall below €20,000 at least once. In a bad case (P10) the low point is €7,835.
- 2Editable assumptionsDelay uncertainty and sales volatility are sliders, with the formula written under each one.
- 3ReproducibleRuns are seeded, so the same seed gives the same result, and they run in a Web Worker so the page never freezes.
A forecast that reports its own error
A forecast is only useful if it beats something simple. Scenova replays 17 past weeks using only what was known on each date, then compares its receipts forecast with what actually arrived and with a naive baseline.
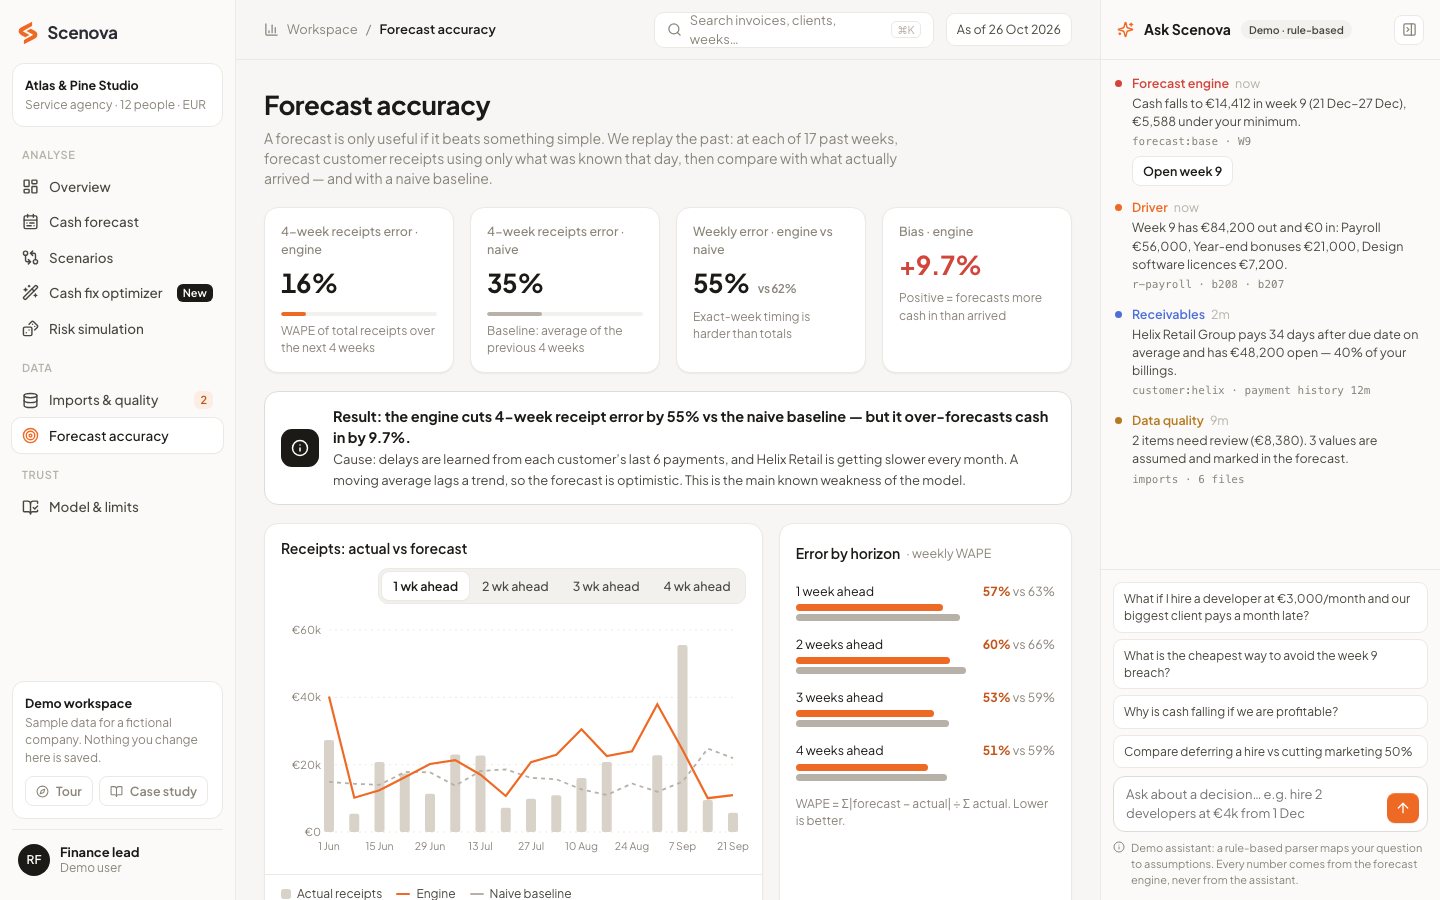
- 1Better than naiveFour-week receipts error is 16% for the engine and 35% for the average of the last four weeks.
- 2Known biasThe engine is about 10% too optimistic: Helix Retail pays later every month, and averages lag a trend.
- 3Said on the pageThe weakness is written next to the result, not left for the user to discover.
An assistant that proposes inputs and never invents a number
Ask “what if I hire a developer at €3,000 a month and our biggest client pays a month late?” and Scenova turns the question into assumptions, marks where each one came from, and waits for confirmation before the engine runs.
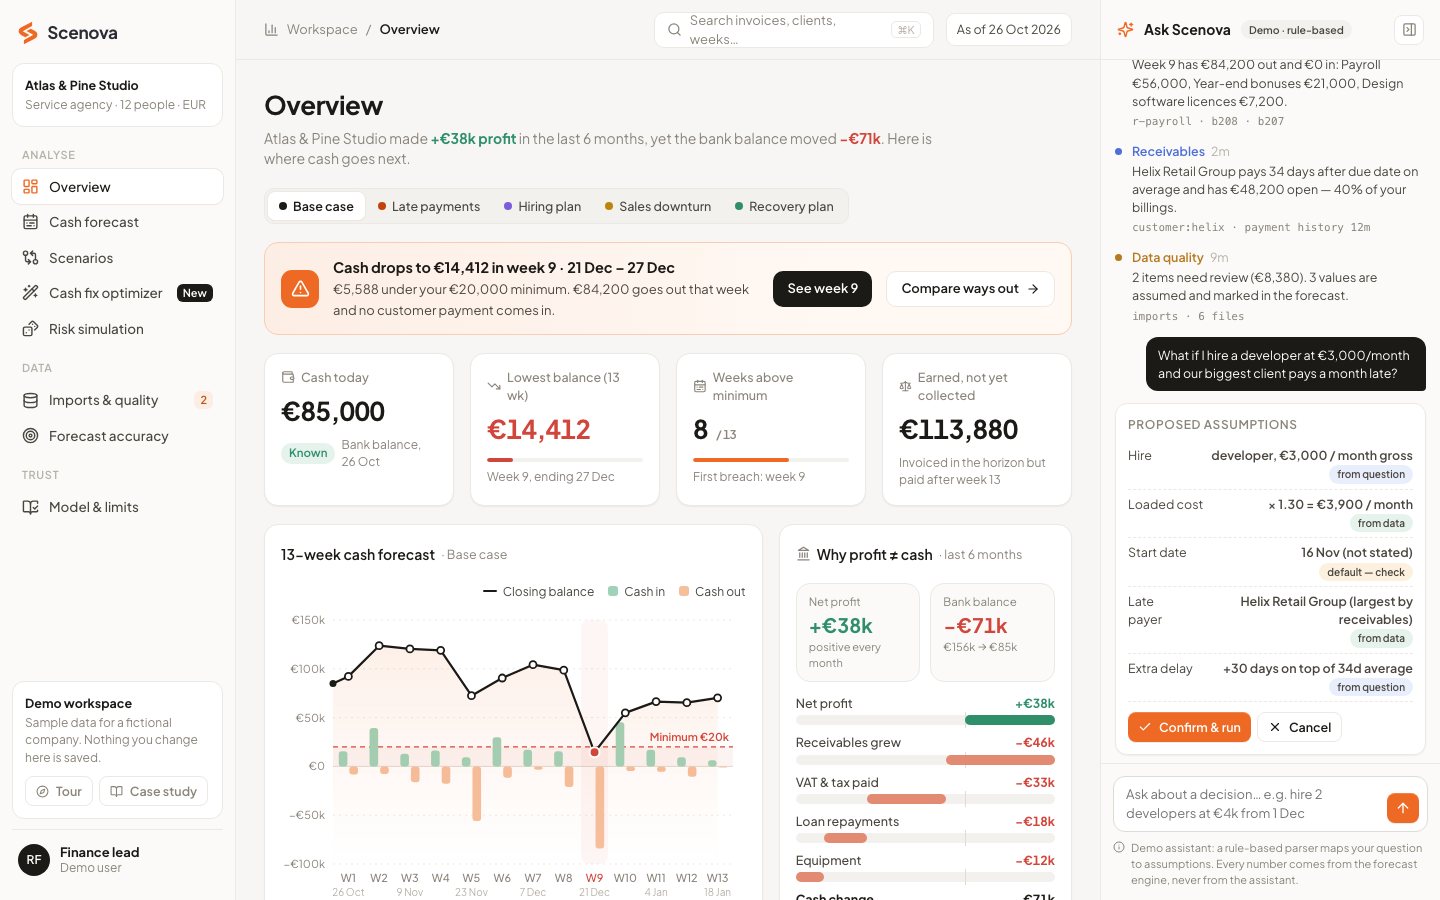
- 1Origins shownThe salary comes from the question, the 1.30 employer cost and the late payer from the data, and the start date is a default to check.
- 2Nothing runs on its ownThe engine only runs after the user confirms, and the answer explains the result with its sources.
- 3Ready for an LLMThe parser is rule-based today. Its output has the shape an LLM with function calling returns, so it can be swapped in later.
How the numbers are made.
Architecture.
Engineering deep dives.
1. Exhaustive search, not a solver
- Problem
- The finance lead needs the cheapest set of treasury moves that keeps cash above the minimum, and needs to see why it is the cheapest.
- Approach
- With seven moves there are only 128 plans, so every one runs through the full forecast. Costs come from the forecast's own discount, fee and interest lines. One unit test checks all 128 plans to prove the answer really is the cheapest.
- Trade-off
- Exhaustive search stops being practical somewhere past fifteen moves. At that point a solver would replace it.
2. From 270 µs to 21 µs per forecast
- Problem
- The optimizer and its stress tests run thousands of forecasts. The page has to answer while the user is still looking at it.
- Approach
- Date maths is memoised and each week is totalled in a single pass, which took one forecast from about 270 µs to 21 µs on a laptop. The full search with stress tests finishes in under 100 ms, off the main thread, and stale results are ignored.
- Trade-off
- Memoisation is extra state to keep correct, so the engine's tests cover the cached paths too.
3. Cheapest is not safest
- Problem
- The cheapest fix clears the minimum by only €3,912. One late payment and it fails.
- Approach
- The best plans are stress-tested with 300 simulated payment-date paths each. The page shows the cheapest plan (€38, 14% of paths still breach) next to the robust one (€188, 7%).
- Trade-off
- The robust plan costs €150 more. Scenova shows the trade and leaves the choice to the finance lead.
4. A backtest against a naive baseline
- Problem
- A forecast with no error measure is a guess with decimals.
- Approach
- Seventeen past weeks are replayed with no look-ahead and compared with the average of the last four weeks. The engine's 4-week receipts error is 16% against 35%. The first version, with one date per invoice, lost to the naive baseline; a spread of dates won.
- Trade-off
- The forecast still uses one date per invoice so each line stays traceable, while the backtest uses the spread. The two are not aligned yet.
5. An assistant that never produces a number
- Problem
- In finance, an AI that invents a figure is worse than no AI at all.
- Approach
- A question becomes assumptions, each marked as coming from the question, the data or a default. A missing salary is asked for, not guessed. Nothing runs until the user confirms, the engine computes, and the assistant only explains.
- Trade-off
- A rule-based parser understands fewer phrasings than an LLM. Its output format is what function calling returns, so Gemini could replace it without changing the flow.
6. Honest about uncertainty
- Problem
- Monte Carlo percentages look like promises, and every model is wrong somewhere.
- Approach
- Runs are seeded and labelled as a share of model runs, not a real-world probability. A Model & limits page lists every formula and the known weaknesses: clients are simulated independently, future sales are a flat rate, and credit lines and VAT on new invoices are not modelled.
- Trade-off
- The numbers look less impressive. They are also the ones a finance lead can defend.
What's next.
Where it stands
Scenova is a public, interactive demo on a fictional company, with a guided tour and the code on GitHub. There is no backend and nothing is saved, so anyone can try every screen.
Roadmap
Payment delays that follow each client's trend, to remove the optimism; CSV and Excel import with the same data checks the demo shows; and an LLM such as Gemini with function calling in place of the rule-based parser, keeping the confirmation step.